Table of Contents
Introduction ..............................................................................................................................................2
Accessing the Research Portal and the Reports ……………………………………………….2
Report Pages and Titles .....................................................................................................................5
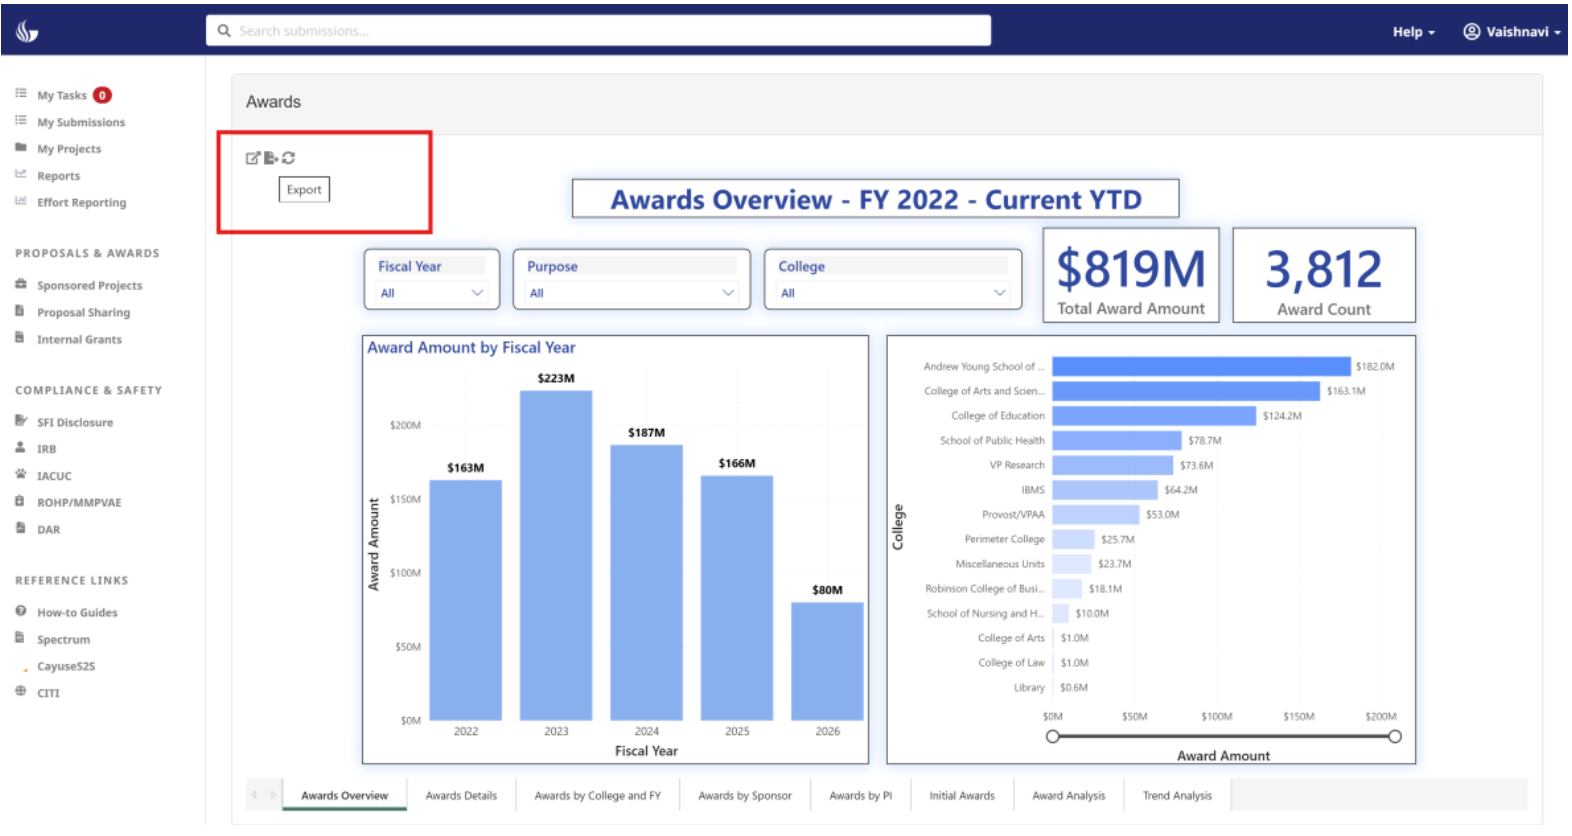
Awards...........................................................................................................................................5
Proposals ......................................................................................................................................6
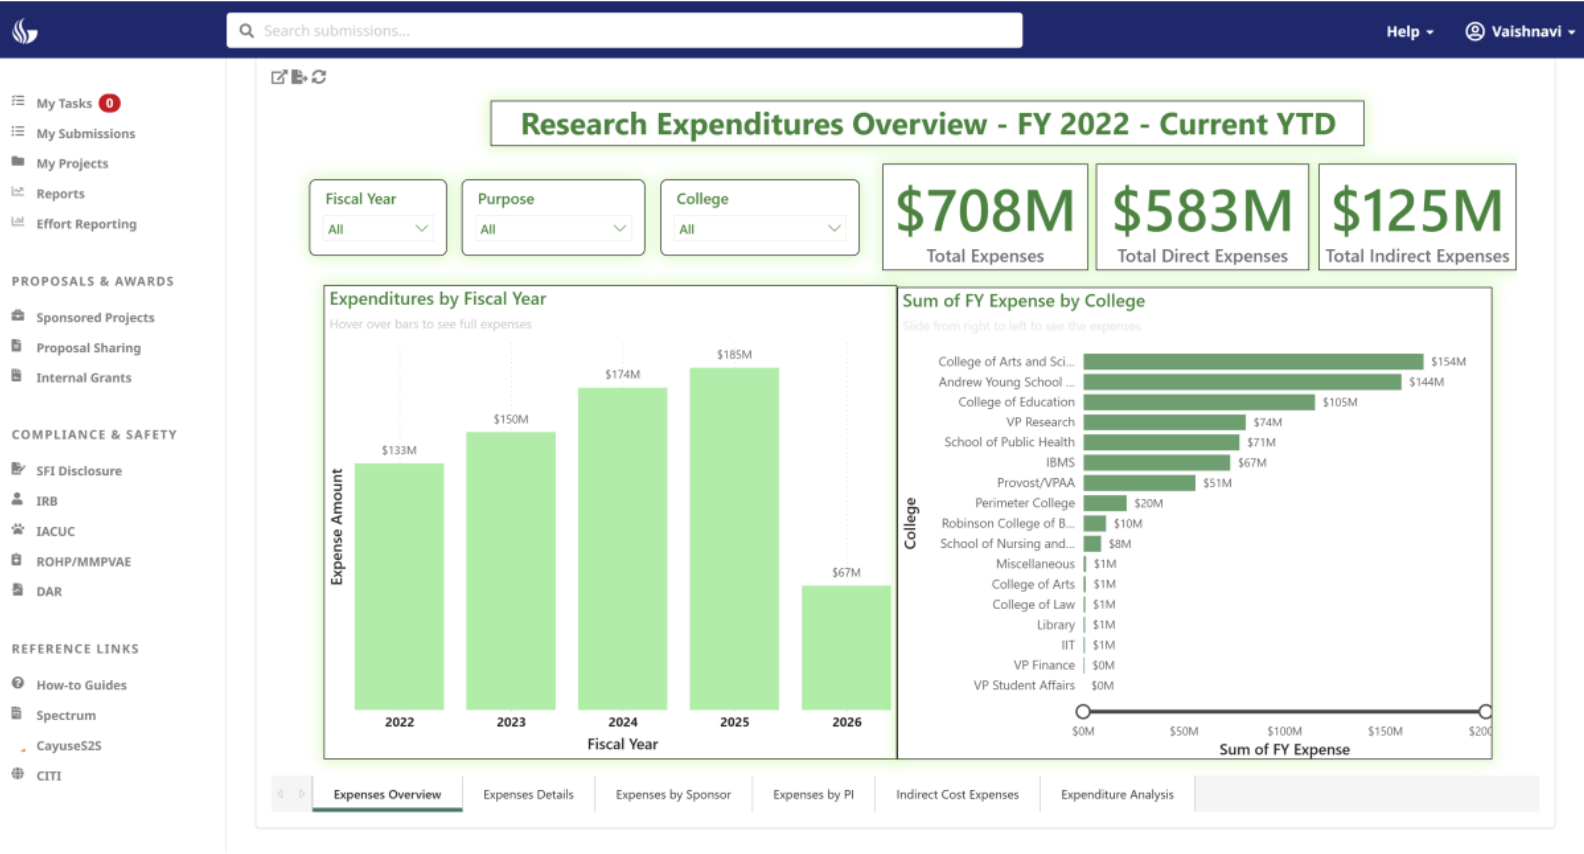
Expenses .......................................................................................................................................6
Key Metrics Used ....................................................................................................................................7
Filtering and Interactivity.................................................................................................................7
Color & Visual Guidelines .................................................................................................................8
Steps to export reports into PDF, PowerPoint and Excel ………………………………10
Steps to export data from Visual ……………………………………………………………………11
Steps to Filter data using a Visual…………………………………………………………………...13
Steps to Copy the Visuals ……………………………...……………………………………………… .14
Best Practices for Users ...................................................................................................................14
¶ 1. Introduction
This document provides an overview and guidance for the Research Portal Report. It summarizes trends in research awards, proposal submissions, and expenditures across fiscal years. The report is structured across three primary areas: Awards, Proposals, and Expenses, with dedicated pages for each.
2. Accessing the Research Portal and the Reports
Step 1: Open your browser and go to https://researchportal.gsu.edu/Home/ReportAwards
Step 2: Log in using your GSU credentials and verify using the DUO app
If you are unable to login or have any issues, please contact: researchsolutions@gsu.edu

Step 3: You will be redirected to the Research Portal home view
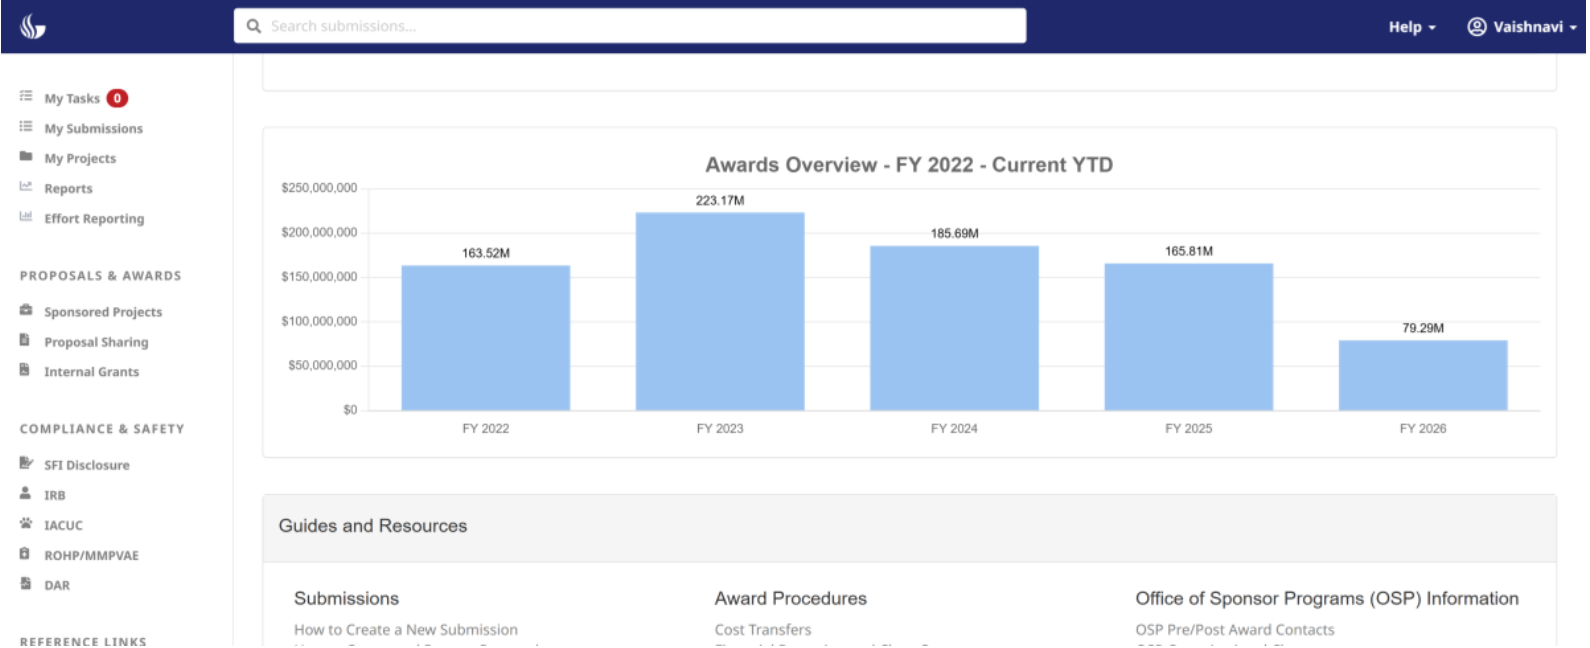
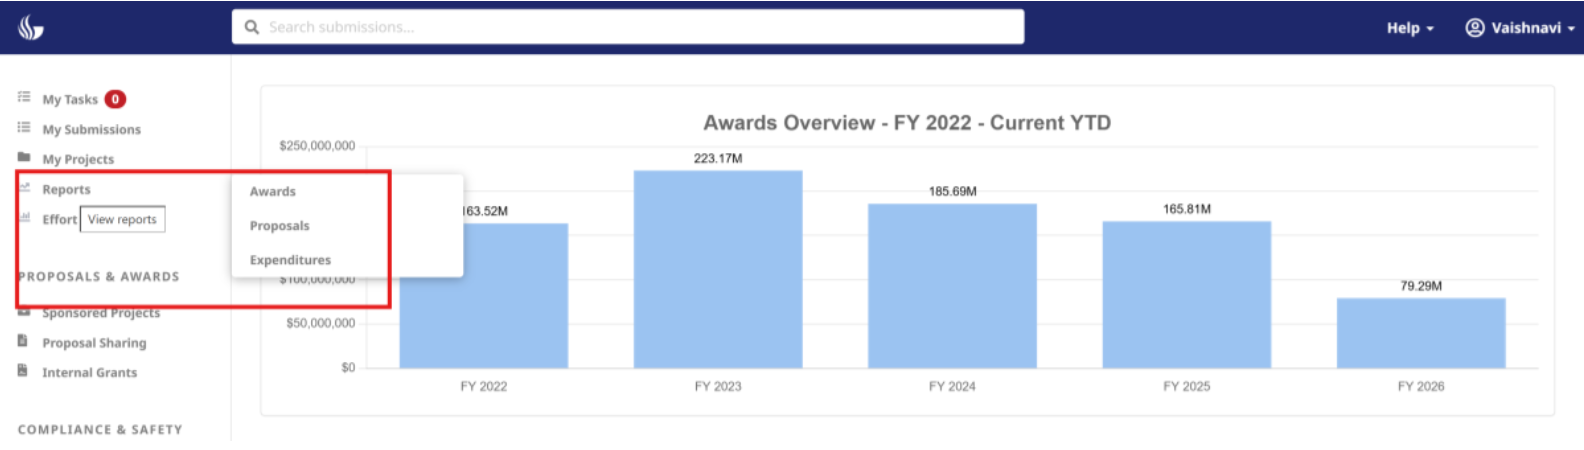
Step 4: Click on reports, they are organized into three main categories:
Awards
Proposals
Expenditures
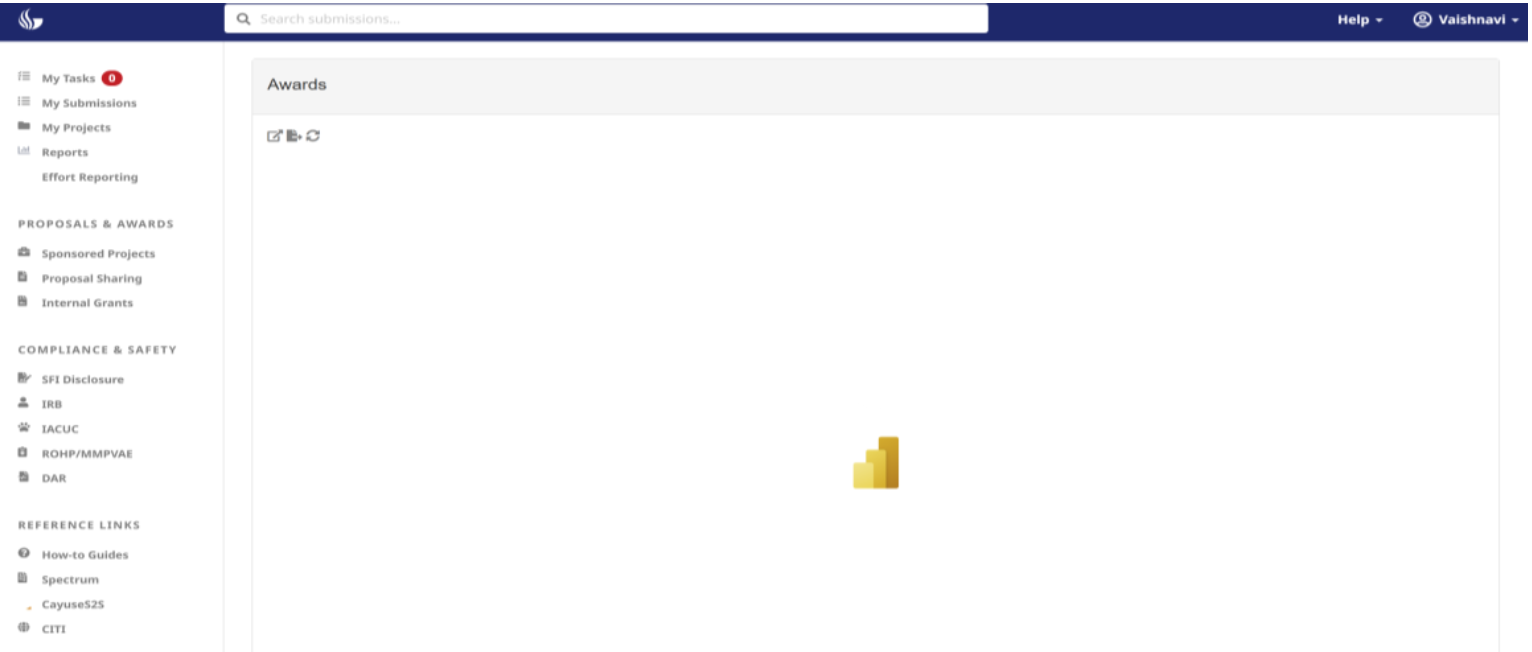
Choose a report from the above categories. It takes a few moments to load the report; it shows the Power BI icon and loads the report.
Note: If you see a access error, please go directly to the report in Power BI online here: Awards Overview Report and then go back to the Research Portal where the report will load.
Still don't have access after trying the above, please contact the Research Solutions team at researchsolutions@gsu.edu.
¶ 3. Report Pages and Titles
The reports have three main categories, such as Awards, Proposals and Expenditure. Each Category has subpages.
| Categories | Pages |
|---|---|
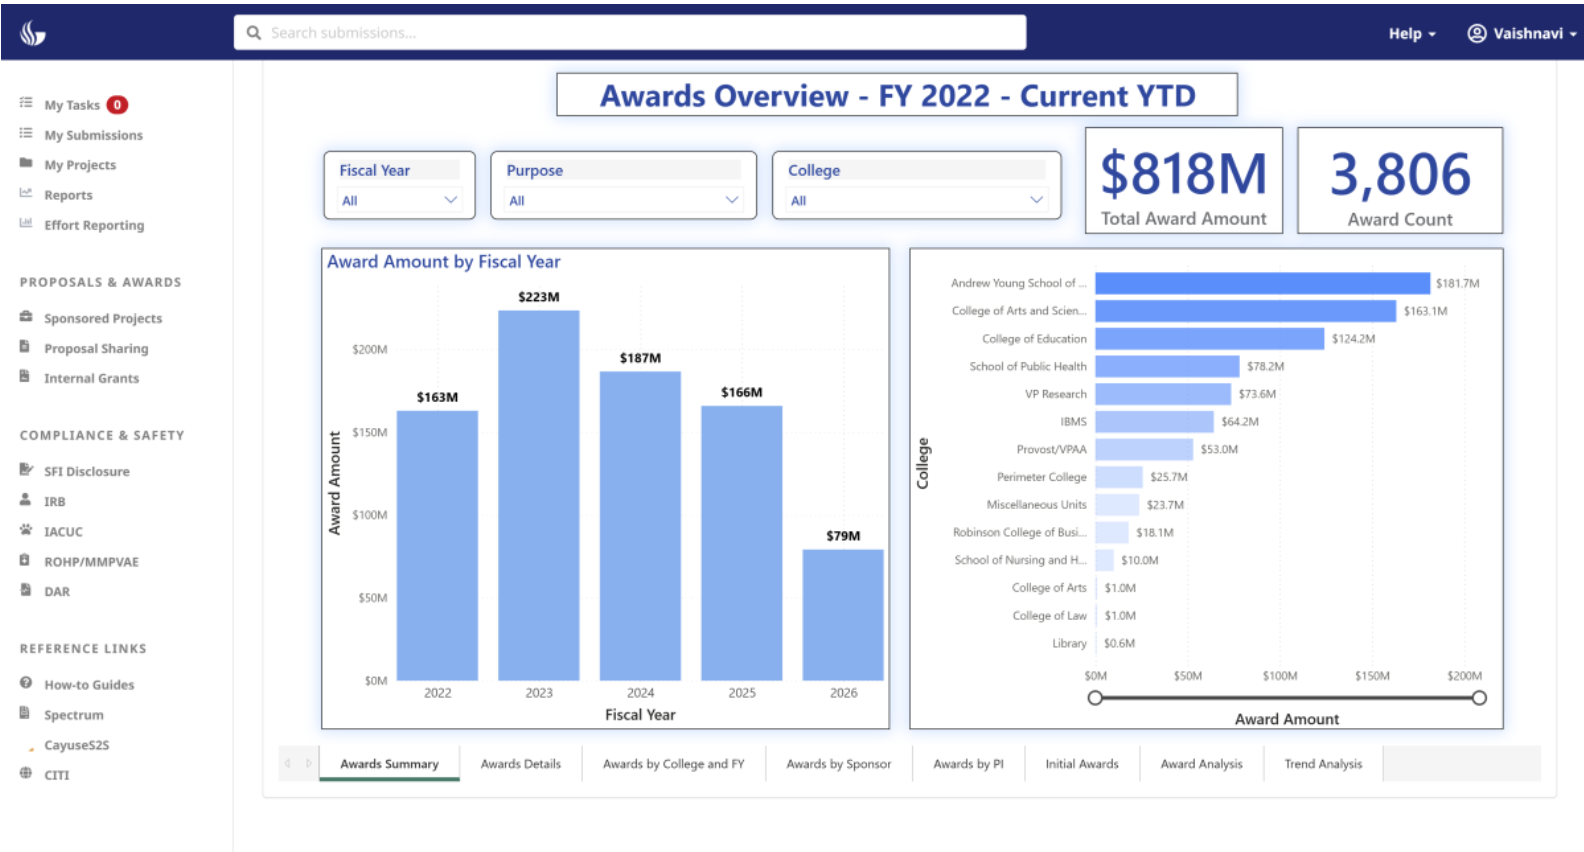
| Awards | Awards Overview Award Details Award by College and FY Award by Sponsor Award by PI Initial Award Award Analysis Award Trend Analysis |
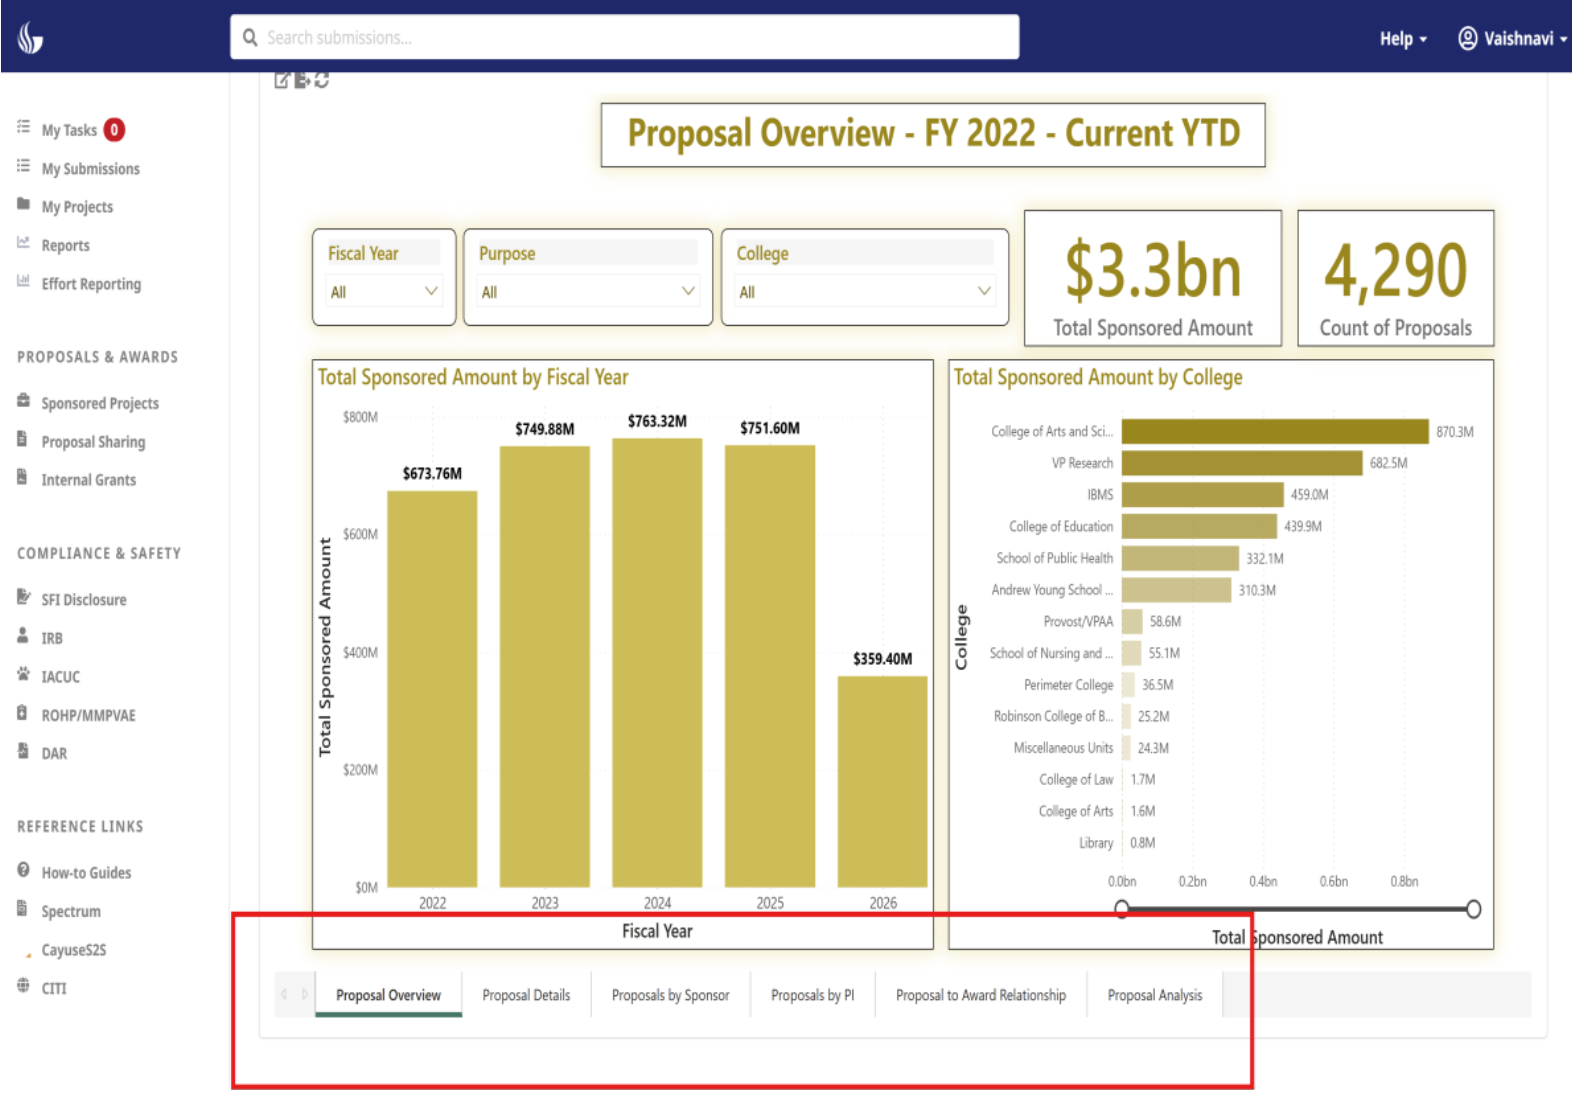
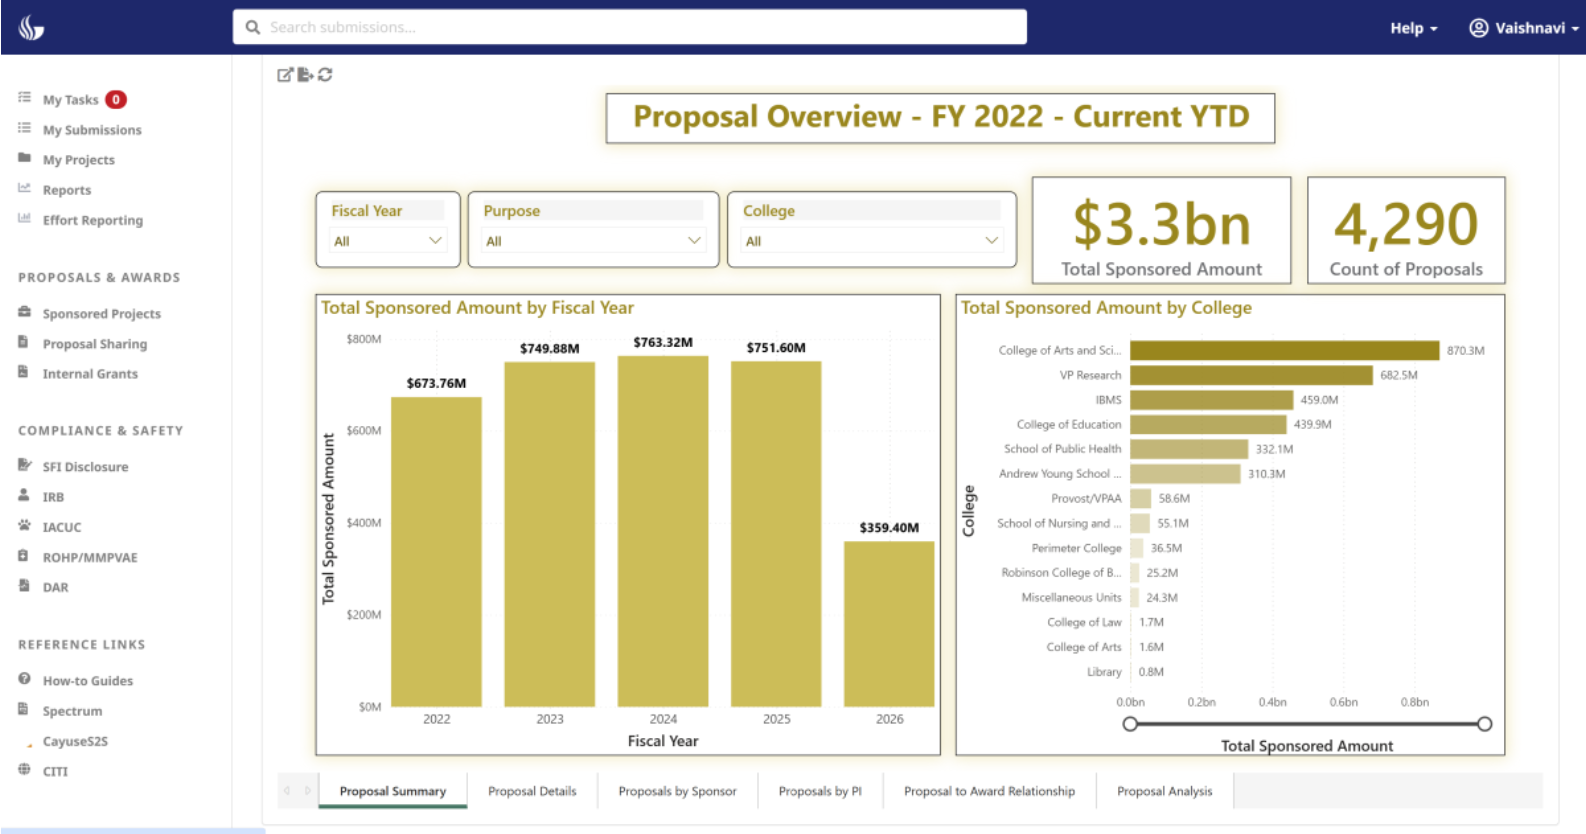
| Proposals | Proposal Overview Proposal Details Proposal by Sponsor Proposal by PI Proposal to Award Relationship Proposal Analysis |
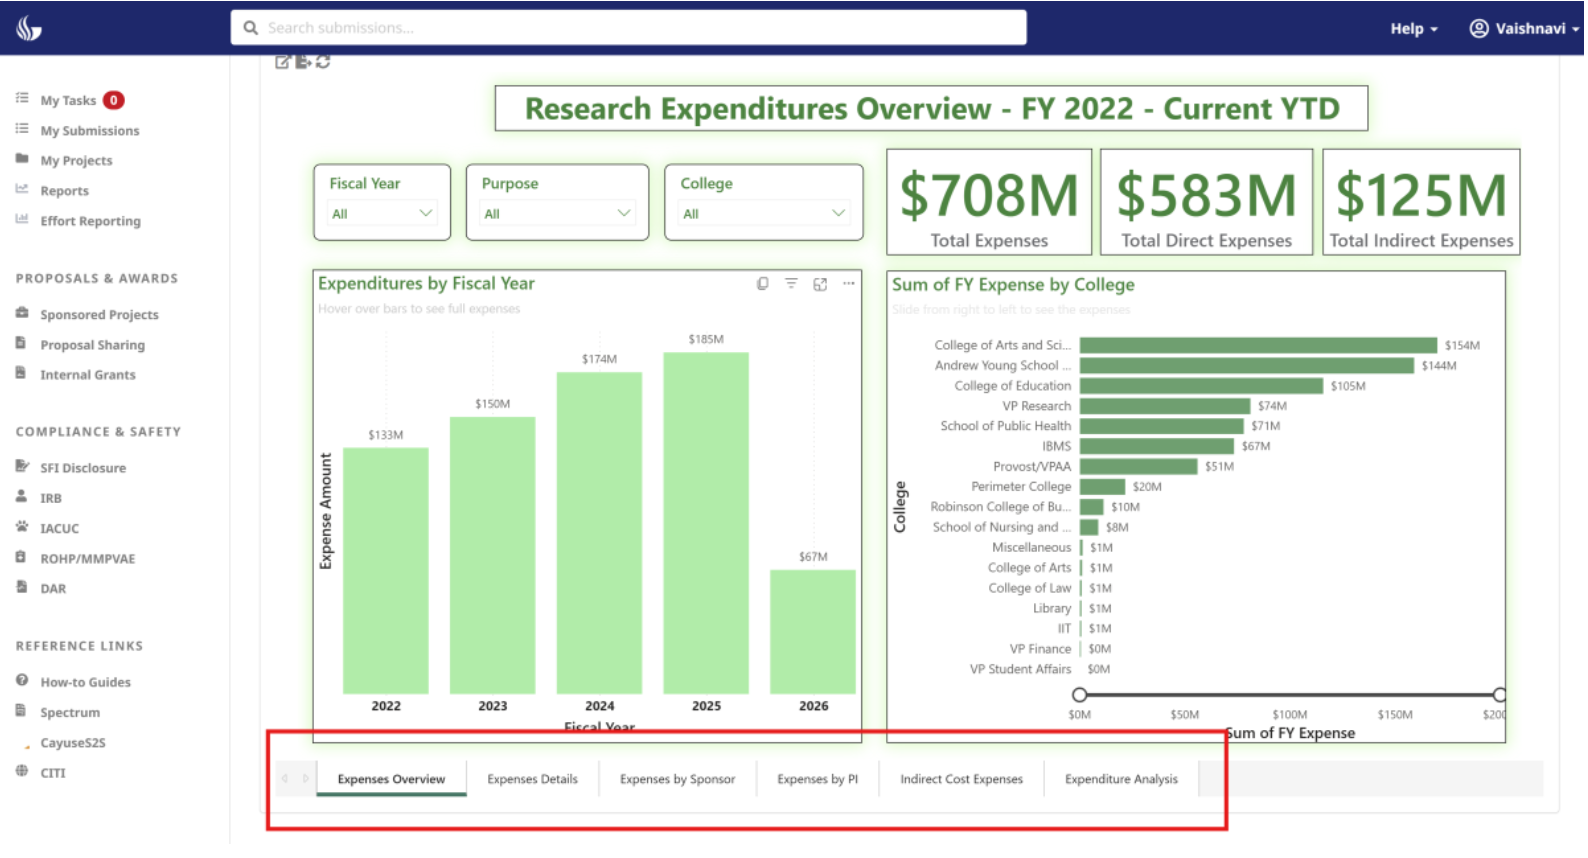
| Expenditure | Expenses Overview Expenses Details Expenses by Sponsor Expenses by PI Indirect Cost Expenses Expenditure Analysis |
Use the menu bar at the bottom of the report to navigate to a different page and switch in between pages.
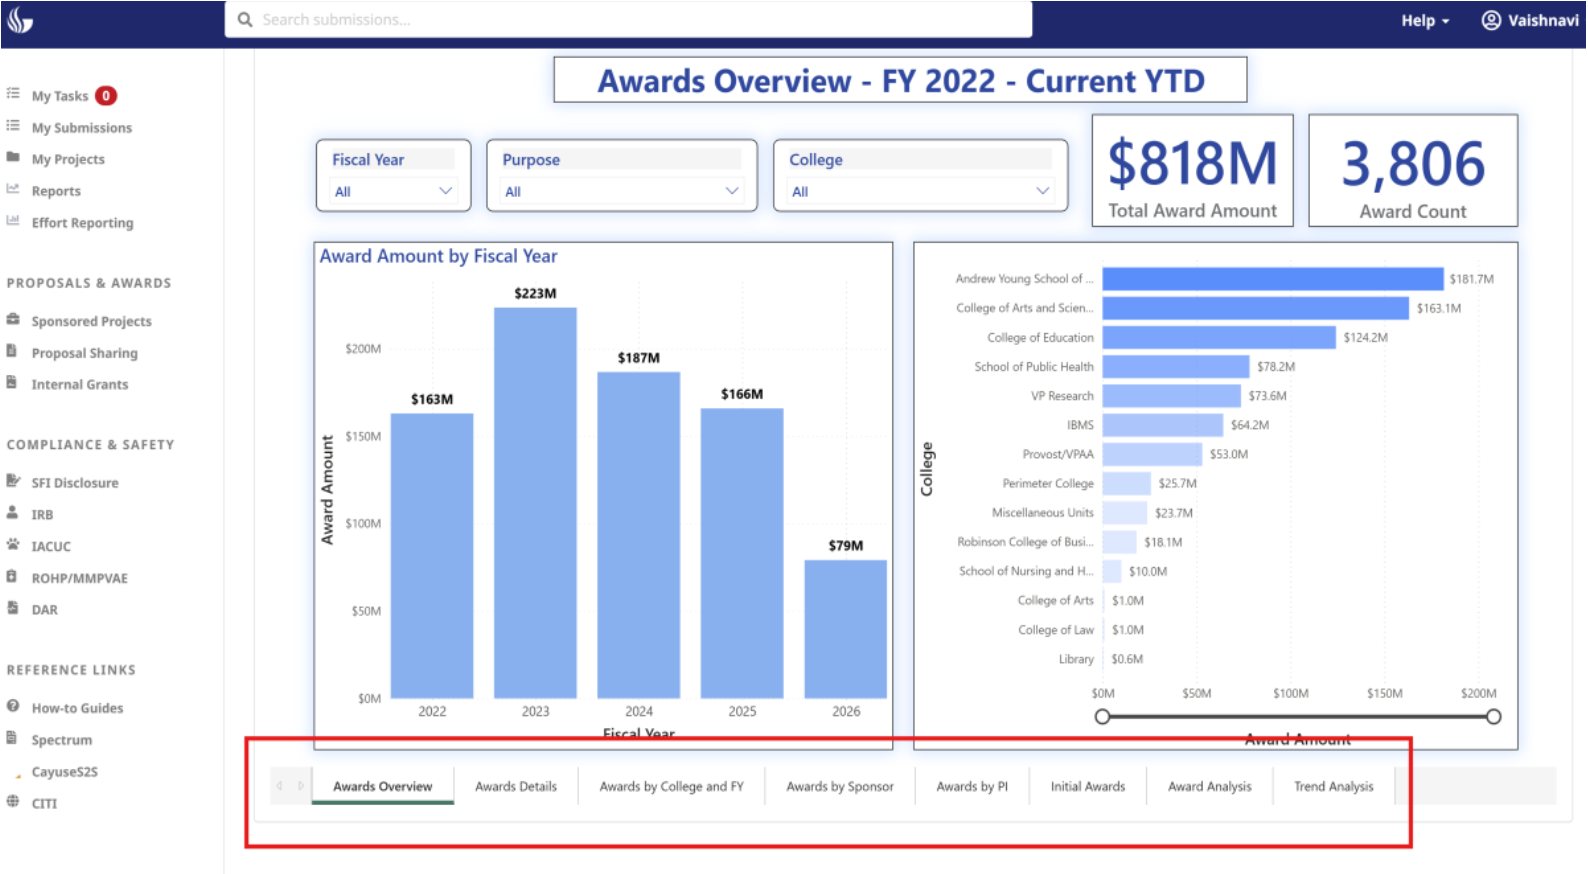
Each page of the report focuses on a specific data area and uses consistent year-over-year trend analysis visuals.
You will see all tabs at the bottom of the report pages for Awards, Proposals and Expenditures so that navigation is easier.
| Page Focus | Page Title |
|---|---|
| Awards | Award Funding Analysis (FY25 vs FY26) |
| Proposals | Proposal Submission Analysis (FY25 vs FY26) |
| Expenses | Research Expenditures Analysis (FY25 vs FY26) |
¶ 4. Key Metrics Used
The report highlights the following metrics to help users track research performance and trends:
Total Award Amount – Overall value of awards received.
Proposal Submissions Count – Number of proposals submitted during the selected period.
Total Research Expenditures – Amount spent on research activities.
Fiscal Year Comparison (FY23 vs. FY24) – Side-by-side comparison of key figures across fiscal years.
Year-over-Year % Change – Percentage increase or decrease compared to the previous year.
¶ 5. Filtering and Interactivity
The report includes interactive slicers that allow users to filter the data dynamically and perform comparative analysis. Users can apply filters to focus on specific time periods, departments, or sponsor categories.
Available Slicers:
Fiscal Year: Select one or multiple fiscal years to view data for the desired time range.
Quarter (Q1, Q2, Q3, Q4): Filter data by specific quarters within the selected fiscal year(s).
Department / College: Choose one or more departments or colleges to analyze data specific to those organizational units.
Sponsor Category: Filter data based on the type of sponsor to understand trends and performance across different sponsor types.
How Slicers Affect the Report:
Selecting values in any slicer updates all connected visuals on the page, including matrix tables, charts, and other visuals.
This allows users to perform comparative analysis easily by narrowing the focus to the desired criteria.
Multiple slicers can be used simultaneously to apply combined filters, helping users explore specific intersections of data (e.g., Department X in Q2 of Fiscal Year 2025).
¶ 6. Color & Visual Guidelines
The report uses a clear and consistent color scheme so users can easily identify the type of data they are viewing:
Blue Shades → Awards: Whenever you see blue, the data and visuals are related to Awards.
Gold/Yellow Shades → Proposals: Yellow or golden
Green Shades → Expenses: Green is used for all Expense data and visuals.
By following these color cues, users can quickly understand the context of the information without needing to read labels in detail.
¶ 7. Export Reports into Excel, PowerPoint and PDF formats.
Step 1: In the toolbar at the top, click the Export button, it redirects to Power BI
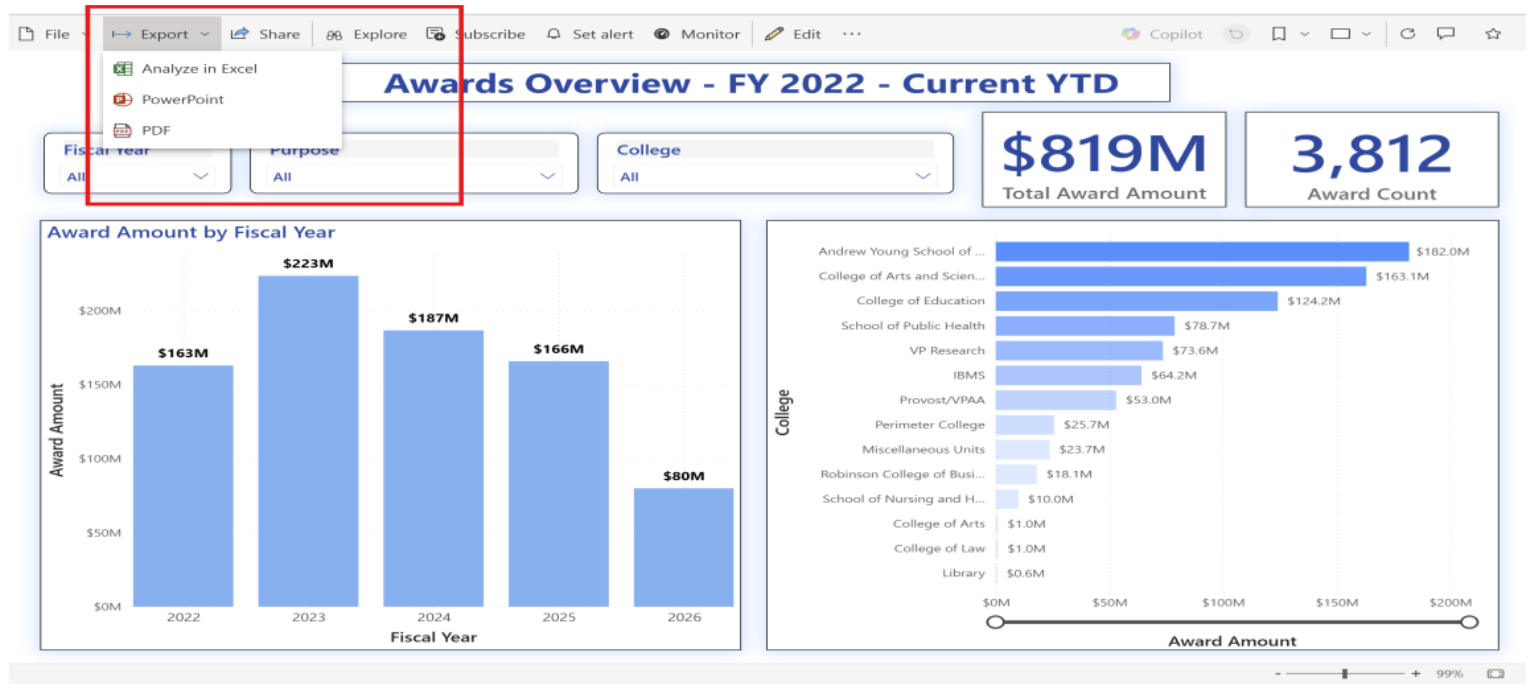
Step 2: Select the desired export format: PDF, PowerPoint (PPTX), or Excel (Excel only works for table or matrix visuals).
Step 3: When prompted, choose whether to export the current page, the entire report, or in the case of Excel, the data format.
Step 4: Click Export
Step 5: The Reports generates the file in the selected format, and it will be downloaded automatically.
¶ 8. Steps to Export Data from the report visual
Step 1: Open the report page that contains the visuals you want to export.
Step 2: Click on the visual to highlight it/hover on the visual.
Step 3: Click the ellipsis (…) / More options at the top-right corner of the visual.
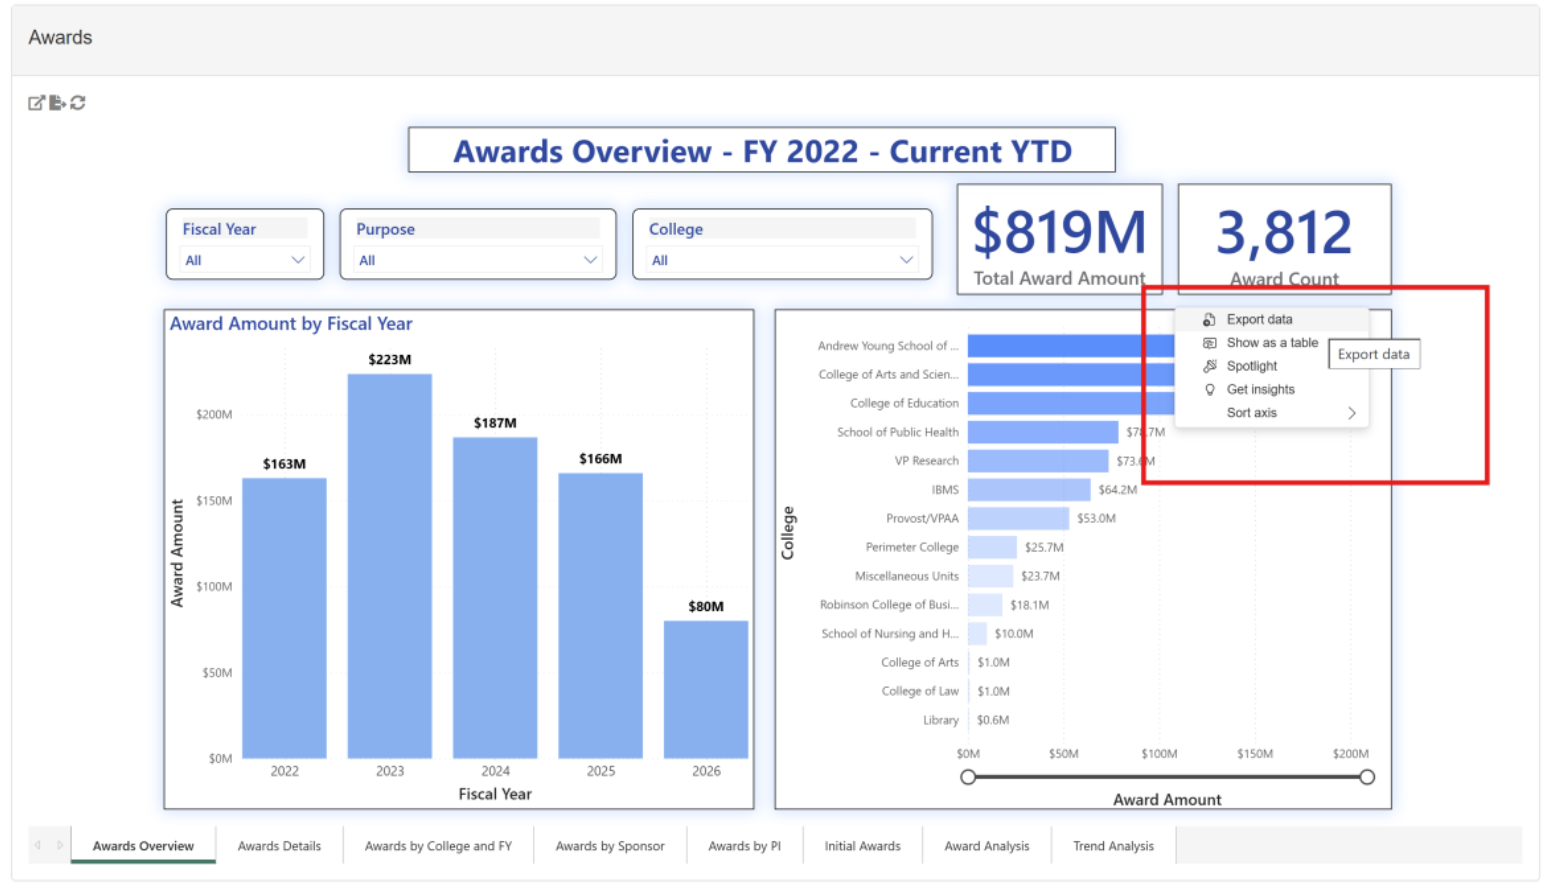
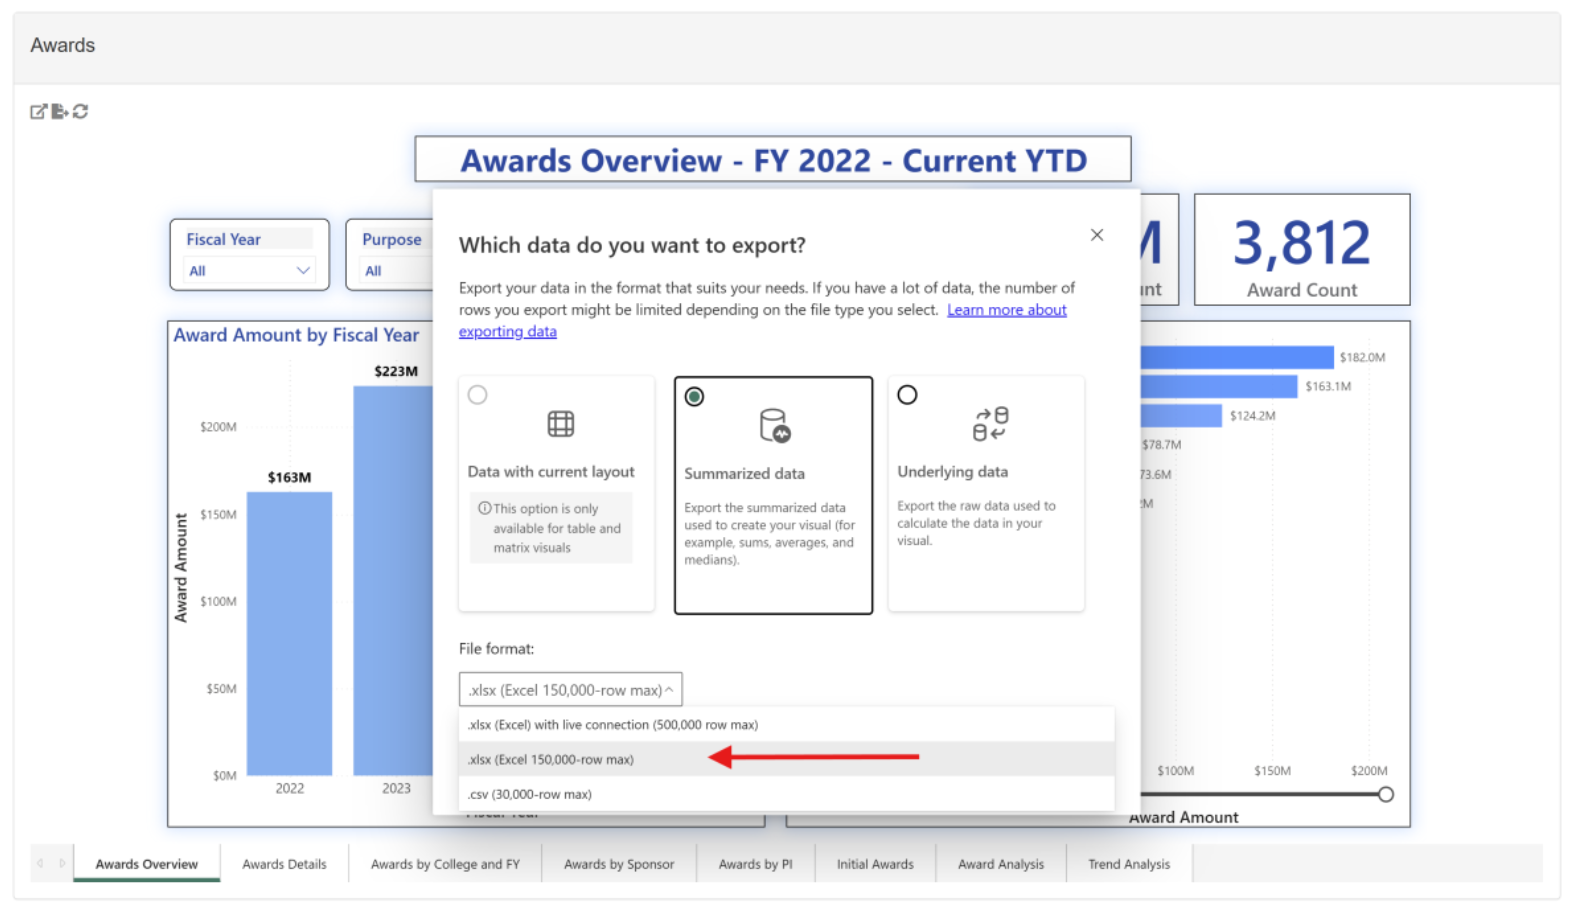
Step 4: From the menu, select Export data.
Step 5: In the dialog box, choose the second file format — .xlsx (Excel) for tables or matrix visuals to preserve formatting, or .csv for charts to get underlying numerical data.
Step 6: Choose the data type — Summarized data to export the data as displayed in the visual, or Underlying data to export all rows from the dataset (availability depends on permissions).
Step 7: Click Export and save the file to your preferred location on your computer.
Step 8: Note that some custom visuals may not support exporting, and the ellipsis (…) will be disabled in such cases.
¶ 9. Steps to Filter Data Using Visual in the reports
Step 1: Open the report page that contains the visuals you want to use for filtering.
Step 2: Identify the visuals you want to interact with, such as a bar chart, column chart, pie chart, or table.
Step 3: Click on the element in the visual that represents the value you want to filter by.
For example, click a bar on a bar chart or slice in a pie chart.
Step 4: Observe that other visuals on the same report page automatically update to reflect the filtered data.
Step 5: To select multiple values for filtering, hold the Ctrl key and click additional elements in the visual.
Step 6: To clear the filter applied by the visual, click on the same element again to revert to the default filter settings of the visuals.
Step 7: If the visual is configured as a cross-highlight, selected values may only partially highlight related data in other visuals instead of filtering all rows.
Step 8: If needed, combine visual filtering with filter pane filters or slicers for more complex filtering logic across multiple fields.
¶ 10. Steps to Copy Visual from the Report.
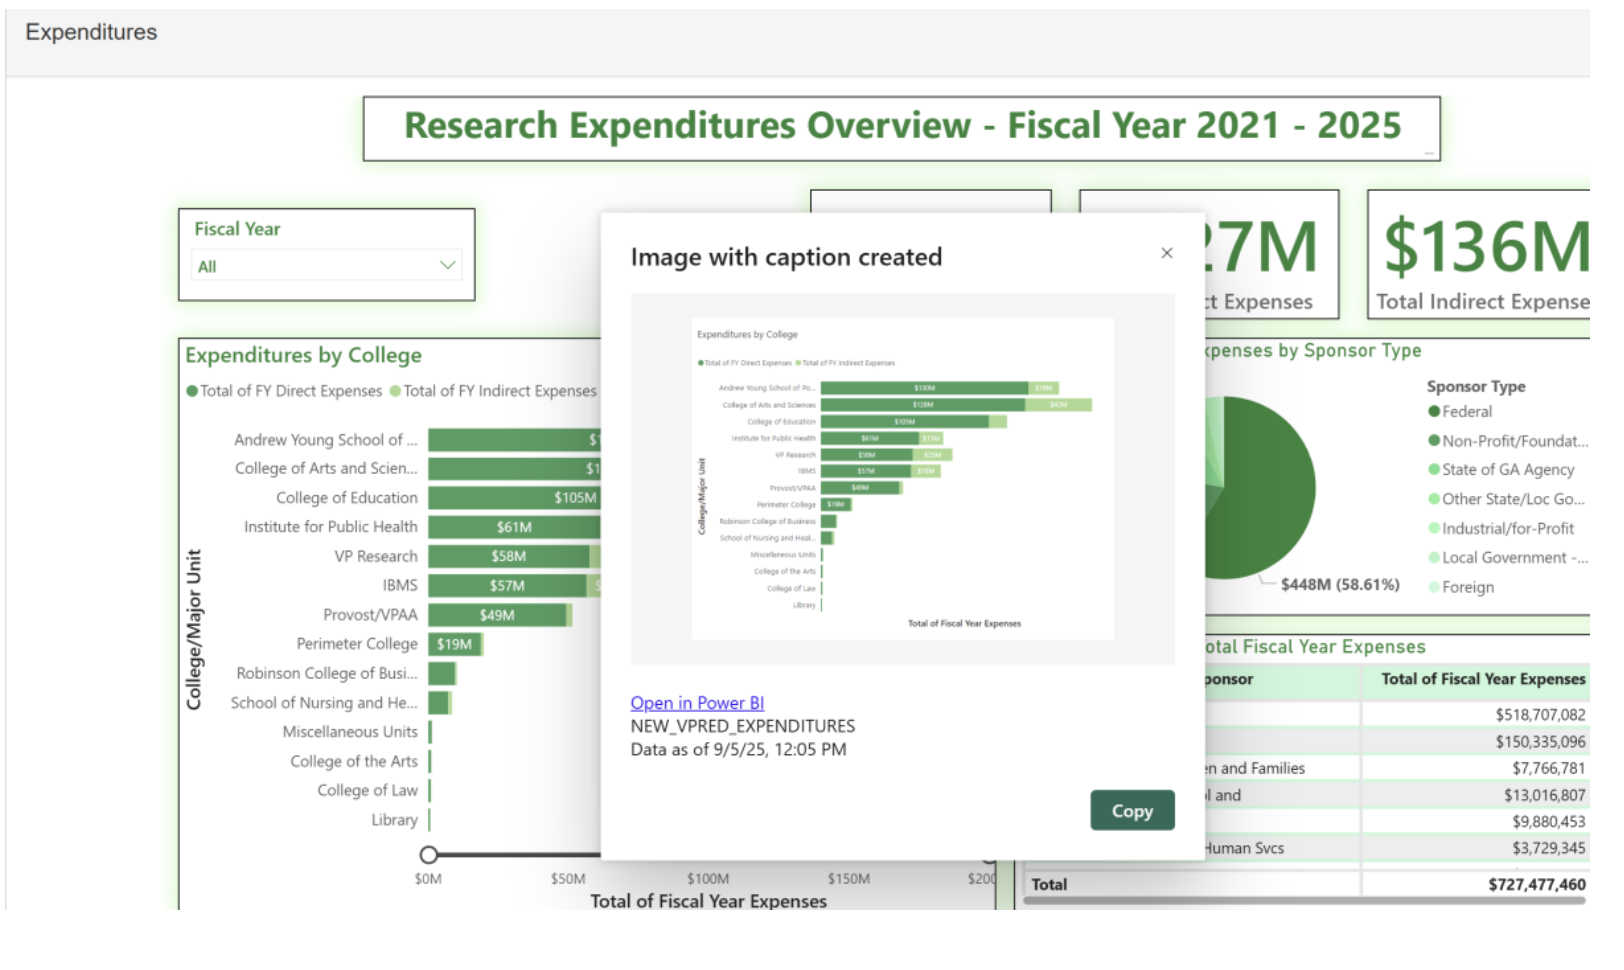
Step 1: Hover over the visual you want to copy and click the Copy button in the top-right corner of the visual.
Step 2: Select Copy
Step 3: Paste it to your destination (e.g., Word, PowerPoint, or Outlook) using Ctrl + V or right-click → Paste.
¶ 11. Best Practices for Users
Use the Quarter slicer (Q1, Q2, etc.) to focus your analysis.
All slicers are synchronized, so filtering updates every visual consistently.
Navigate across pages using the tabs below, with color themes for easy recognition: Gold = Proposals, Blue = Awards, Green = Expenses.
Hover over visuals to view detailed tooltips.
Check TOTAL rows for departmental or college-wide summaries.